Table of Contents
Key Metrics by Marketing Channel
Marketing without measurement is guesswork. Effective marketing dashboards reporting transforms the staggering volume of data available in 2026 into clear, actionable insights that drive better decisions. The challenge for Singapore businesses is no longer access to data but the ability to distil thousands of data points into narratives that inform strategy and demonstrate value.
SEO metrics: For search engine optimisation, track organic traffic volume and trend, keyword rankings for target terms, organic click-through rate, domain authority, referring domains and organic conversion rate. Core Web Vitals and page experience metrics are also essential as they directly affect rankings.
PPC metrics: Pay-per-click campaigns are measured by impressions, clicks, CTR, CPC, conversion rate, CPA, ROAS, quality score, impression share and ad position. Segment by campaign type, ad group, keyword, device and audience. Budget pacing metrics ensure efficient spending.
Social media metrics: Social media performance spans reach, impressions, engagement rate, follower growth, click-through rate and video completion rates. Move beyond vanity metrics to focus on engagement rate and the quality of interactions.
Email marketing metrics: Key metrics include deliverability rate, open rate, click-through rate, conversion rate, unsubscribe rate, list growth rate and revenue per email. Segment by campaign type and audience segment.
Overall marketing metrics: At the aggregate level, track MQLs, SQLs, customer acquisition cost, customer lifetime value, CLV-to-CAC ratio, marketing-sourced revenue and return on marketing investment. These connect marketing activity to business outcomes for Singapore leadership teams.
Dashboard Tools and Platforms
The right dashboard tool makes the difference between a marketing dashboards reporting system used daily and one that gathers dust.
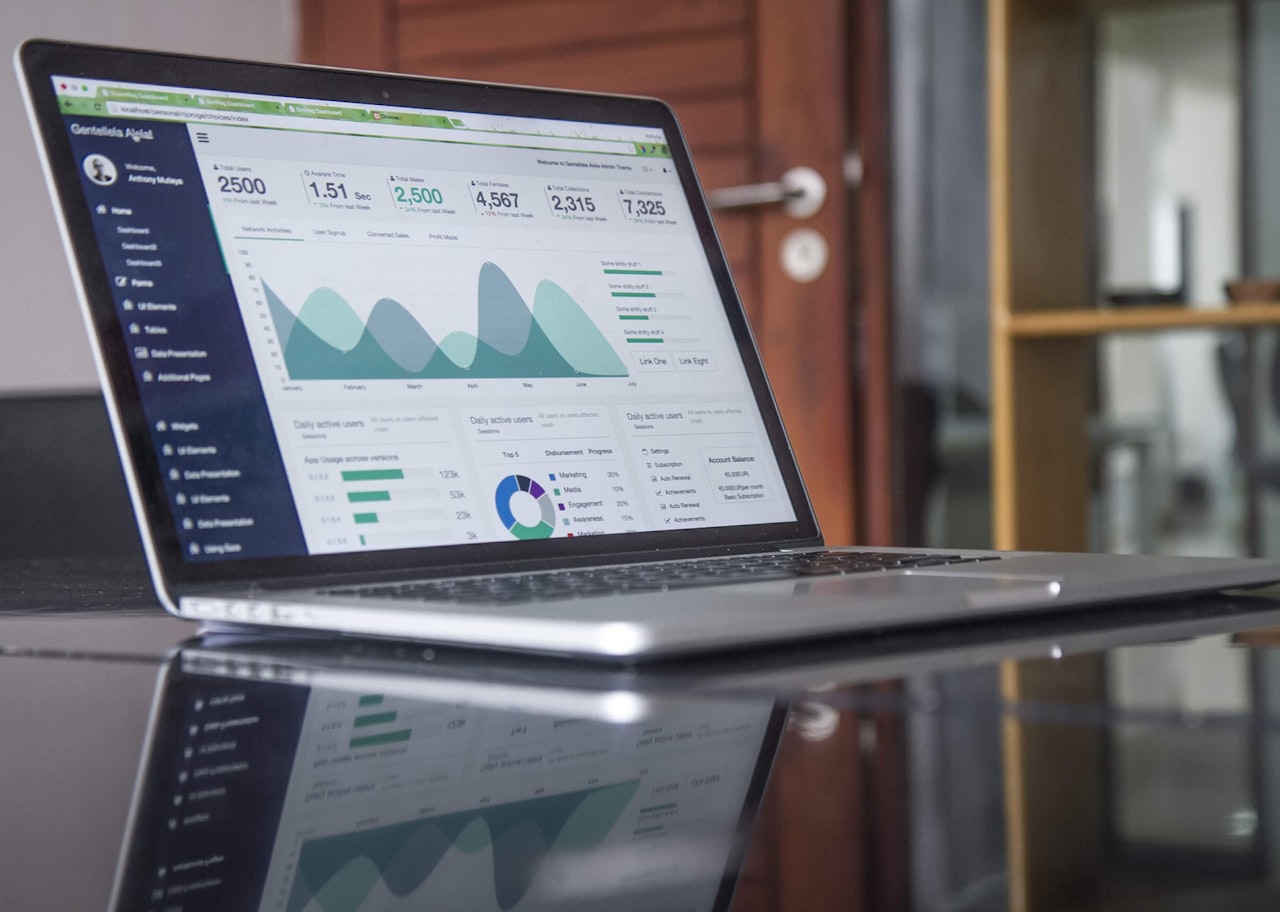
Looker Studio: The go-to free option with native Google product integration. Ideal for Google-centric marketing stacks common among Singapore SMEs. Offers drag-and-drop interface, shareable dashboards and community connectors for third-party sources.
Tableau: Enterprise-grade visualisation handling large, complex datasets. Steeper learning curve and higher cost but unmatched analytical capability for organisations with complex data needs.
Databox: Designed for marketing metrics with pre-built templates, mobile-first design and goal-tracking features. Popular among agencies and marketing teams wanting quick setup.
Power BI: Strong option for Microsoft ecosystem organisations with robust data modelling. Power BI Desktop is free with Pro and Premium plans for collaboration.
Agency tools: Platforms like AgencyAnalytics, DashThis and Whatagraph offer client-facing dashboards with white-labelling and automated scheduling. Ideal for agencies managing multiple Singapore clients.
Building a CMO Dashboard
The CMO dashboard gives marketing leadership a real-time overview answering “Is marketing working?” Design it with these components for Singapore business leaders.
Revenue metrics: Display marketing-sourced revenue, pipeline value and revenue attribution by channel. Include month-to-date and year-to-date comparisons against targets.
Lead and conversion metrics: Show total leads, MQLs, SQLs and conversion rates between stages. A funnel visualisation highlighting bottlenecks and lead velocity rate as a leading indicator of future revenue.
Channel performance summary: High-level comparison of all active channels on spend, leads, cost per lead and ROAS. This allows quick identification of performing and underperforming channels.
Budget and spend: Total spend against budget, pacing and allocation by channel. Link to your broader digital marketing strategy for alignment.
Trends and forecasts: Include 12-month rolling averages, year-over-year comparisons and forward-looking forecasts to contextualise whether performance is improving or declining.
Automated Reporting
Manual report creation is time-consuming and error-prone. Automation frees your Singapore marketing team to focus on analysis and strategy rather than data collection.
Scheduled delivery: Set up weekly summaries, monthly comprehensive reports and quarterly reviews arriving automatically. Include brief commentary highlighting key takeaways.
Real-time dashboards: For metrics requiring constant monitoring such as paid campaign spend pacing and website uptime, create auto-updating dashboards accessible via mobile apps.
Alert-based reporting: Configure alerts when metrics exceed thresholds, for example when daily ad spend exceeds budget or traffic drops significantly. Alerts catch issues immediately rather than at the next scheduled review.
AI-assisted insights: In 2026, AI-powered tools automatically surface anomalies and trends, generating plain-language summaries of what changed, possible causes and recommended actions. These complement rather than replace human analysis.
Visualisation Best Practices
Good visualisation makes insights obvious while poor visualisation hides them behind clutter. Follow these principles for effective marketing dashboards reporting.
Choose the right chart type: Line charts for trends, bar charts for comparisons, pie charts for composition (five or fewer segments only), tables for precise values. Avoid complex charts when simpler ones communicate the same information.
Reduce clutter: Remove unnecessary gridlines, borders, 3D effects and excessive colour. Follow progressive disclosure: show the most important information prominently with detail available on demand.
Use colour intentionally: Green for positive trends, red for negative, blue for neutral. A single highlight colour draws attention to the most important data point. Avoid rainbow colour schemes.
Provide context: Always show comparisons versus target, previous period and same period last year. Add annotations for significant events like campaign launches or algorithm updates that explain sudden changes for Singapore marketing teams.
Reporting Cadence and Rhythm
Different frequencies serve different purposes. Establishing a clear cadence ensures the right information reaches the right people at the right time.
Daily monitoring: Real-time dashboards and automated alerts for active campaigns, spend pacing and website health. Avoid over-reacting to normal daily fluctuations.
Weekly reports: Concise pulse checks covering top KPIs, notable wins and concerns and planned activities. Five minutes to review.
Monthly reports: Comprehensive performance across all channels, progress against targets, budget utilisation and key insights with qualitative analysis explaining what happened, why and recommended actions.
Quarterly reviews: Strategic assessment of performance against objectives, channel mix effectiveness, competitive landscape and recommended adjustments. Bridge between tactical reporting and annual planning for your Singapore business.
Stakeholder-Specific Reports
Tailoring reports to each audience ensures relevance and maximises impact.
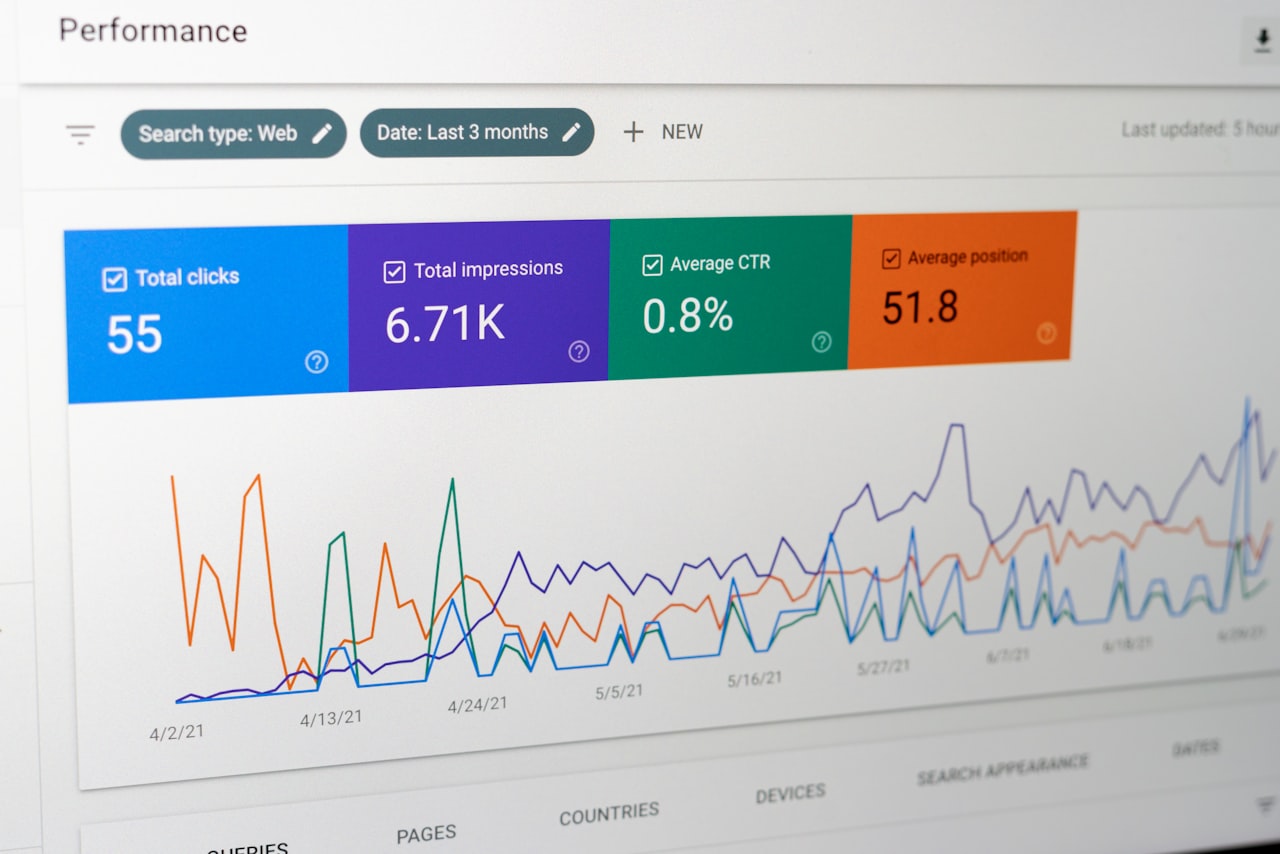
CEO and board: Revenue impact, customer acquisition, market share. Simple visualisations, executive summaries. One to two pages. Avoid channel-level detail.
CMO and marketing leadership: Comprehensive channel comparisons, budget tracking, pipeline metrics. The CMO dashboard with enough detail for decision-making.
Channel specialists: Granular, actionable data for their specific channel. Detailed metrics, segment breakdowns, A/B test results. Working documents for daily optimisation, leveraging insights from your content marketing and paid advertising data.
Clients (for agencies): Balance transparency with clarity. Results tied to investment, leads generated, progress against KPIs. Avoid jargon, explain what numbers mean in business terms and include clear next steps.
Frequently Asked Questions
What is the best free marketing dashboard tool?
Looker Studio is the best free option for most marketing teams. It integrates natively with Google products, supports community connectors and offers a flexible drag-and-drop interface covering the needs of small to mid-sized Singapore businesses.
How many metrics should be on a marketing dashboard?
A well-designed dashboard contains 10-15 metrics. CMO dashboards should have 5-8 high-level KPIs. Channel dashboards can include more detail but should maintain clear hierarchy. Every metric must answer a specific question or inform a decision.
How often should I update my dashboard design?
Data should refresh automatically, ideally daily. The dashboard design itself should be reviewed quarterly to stay aligned with current objectives. Major redesigns are typically needed annually or when significant strategy changes occur.
How do I get stakeholders to actually use the dashboards?
Involve stakeholders in design to ensure dashboards answer their questions. Keep it simple, send regular insight summaries and make dashboards easily accessible via bookmarks or mobile apps. Demonstrate value by using dashboard insights in meetings.
Should I build custom dashboards or use pre-built templates?
Start with templates to get reporting running quickly then customise based on specific needs. Templates provide proven structures ensuring you do not miss important metrics. Add your KPIs, branding and data sources over time.
How do I handle data discrepancies between platforms?
Discrepancies between advertising platforms and analytics tools are normal. Document which data source is authoritative for which metrics and reconcile regularly. Use Google Analytics as your cross-channel truth source for website conversions.
What is the most common reporting mistake Singapore businesses make?
Reporting too many metrics without analysis. A dashboard of numbers without interpretation is a data dump, not a report. Every report should include explanation of what changed, why and what actions are recommended. The analysis is the most valuable part.
How do I calculate marketing ROI for my dashboard?
Marketing ROI equals (marketing-sourced revenue minus marketing cost) divided by marketing cost. Track this at both the channel level and aggregate level. Include both direct attribution and assisted conversions for a complete picture of marketing contribution to your Singapore business.