Cohort Analysis for Marketing: How to Track User Behaviour Over Time and Spot Trends
Table of Contents
What Cohort Analysis Is and Why Marketers Need It
Cohort analysis marketing groups users based on a shared characteristic or experience within a defined time period and tracks their behaviour over subsequent periods. Unlike aggregate metrics that blend all users into a single average, cohort analysis separates users into meaningful groups, revealing trends and patterns that overall metrics conceal.
Consider a simple example. Your aggregate monthly active users are growing steadily. This looks positive until cohort analysis reveals that new user acquisition is increasing while retention is declining. Each monthly cohort returns at a lower rate than the previous one. Without cohort analysis, you would celebrate growth while the underlying health of your business deteriorates.
For Singapore businesses investing in multiple acquisition channels and campaigns, cohort analysis answers questions that standard analytics cannot. Are customers acquired through Google Ads more valuable over time than those from organic search? Did the email onboarding sequence you launched in March improve retention compared to the old version? Are customers who sign up during promotional periods as loyal as those who pay full price? These questions require tracking groups of users over time, which is precisely what cohort analysis delivers. This deeper understanding strengthens your digital marketing decisions.
Types of Cohorts for Marketing Analysis
Acquisition cohorts group users by when they first interacted with your business. Weekly or monthly acquisition cohorts are the most common and answer the fundamental question: “Are the users we are acquiring now better or worse than those we acquired previously?” This cohort type is the default in most analytics platforms and the starting point for most marketers.
Behavioural cohorts group users by a specific action they took, regardless of when they first arrived. Users who completed a purchase, downloaded a resource, or attended a webinar form a behavioural cohort. Tracking these cohorts reveals how specific actions influence long-term behaviour. If users who download your free guide show fifty per cent higher retention than those who do not, that guide is a powerful retention tool worth promoting more aggressively.
Campaign cohorts isolate users acquired through specific marketing campaigns or channels. This allows you to compare the long-term value of different acquisition sources. A campaign that delivers high initial volume but poor retention may be less valuable than a smaller campaign with stronger long-term engagement. Campaign cohorts shift your evaluation from cost per acquisition to lifetime value per acquisition.
Demographic or segment-based cohorts group users by characteristics like industry, company size, location, or plan type. For Singapore B2B businesses, tracking retention by industry cohort reveals which sectors are best suited to your offering. This intelligence informs targeting decisions for both marketing and sales teams.
Setting Up Cohort Analysis in GA4
GA4 includes a built-in cohort exploration that allows you to configure acquisition, return, and metric criteria without any custom code. Access it through the Explore section and select “Cohort exploration” as the technique. The default view shows weekly acquisition cohorts with user retention as the return criterion.
Configure your cohort by defining the inclusion criteria (what action defines the cohort start), the return criteria (what action constitutes a return), the granularity (daily, weekly, or monthly), and the metric you want to track (active users, conversions, revenue, or any custom event). For most marketing analyses, monthly cohorts with a return criterion of “any event” provide a useful starting view.
For more advanced cohort analysis, export GA4 data to BigQuery and build custom cohort queries. BigQuery allows you to define complex cohort criteria, combine multiple data sources, and analyse cohorts at any level of granularity. This is particularly valuable for subscription businesses, SaaS companies, and e-commerce businesses that need to track revenue-based cohorts over long periods.
Supplement GA4 cohort data with data from your CRM, email platform, and payment system. GA4 tracks website behaviour but may not capture the full picture of customer engagement, especially for businesses with offline touchpoints or long sales cycles. Combining data sources creates cohort analyses that reflect the complete customer relationship.
Reading and Interpreting Cohort Tables
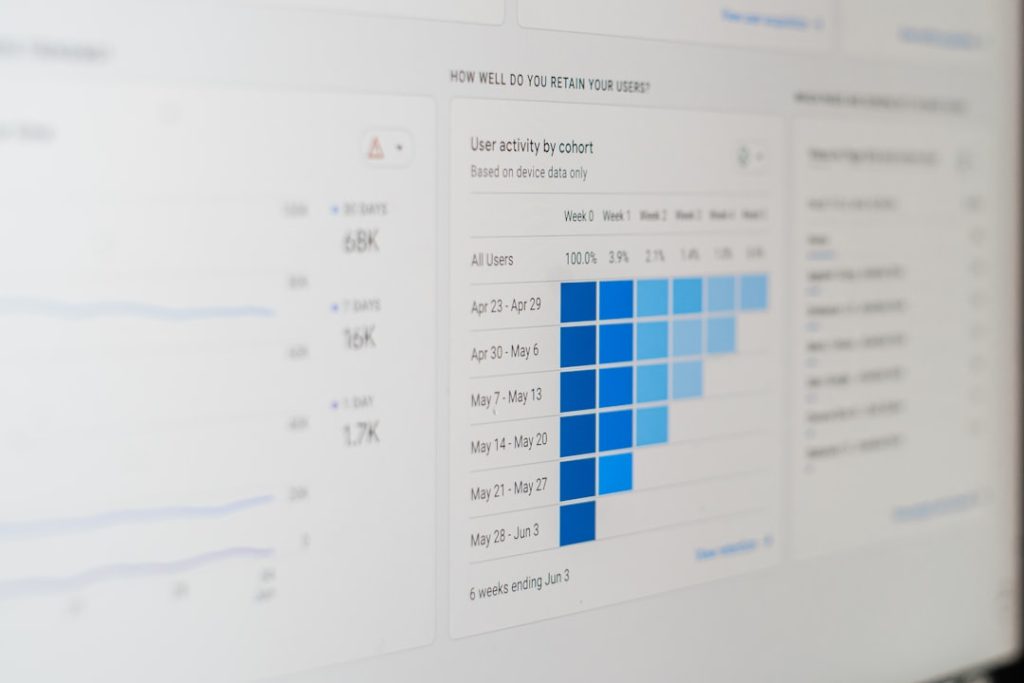
A cohort table displays cohorts as rows and time periods as columns. The first column typically shows the cohort size (number of users in the group). Subsequent columns show the metric value for each period after the cohort’s start date. Reading across a row shows how a single cohort behaves over time. Reading down a column shows how different cohorts behave at the same age.
The diagonal reading pattern is the most revealing. Comparing the same period across successive cohorts (for example, week-two retention for each monthly cohort) shows whether your product, onboarding, or engagement strategies are improving over time. An upward trend means newer cohorts are performing better. A downward trend signals a problem that needs investigation.
Colour coding in cohort tables highlights patterns visually. Darker cells indicate stronger performance. Look for blocks of colour that reveal structural patterns: consistent drop-offs at a specific period suggest a predictable churn point, while gradual fading indicates normal attrition, and sudden colour changes point to specific events or changes that affected behaviour.
Always contextualise cohort data with external factors. A cohort that shows unusually high retention may have been acquired during a period when you launched a popular new feature. A cohort with poor retention may coincide with a website redesign that introduced friction. Annotate your cohort tables with key business events to enable accurate interpretation.
Retention Analysis With Cohorts
Retention is the most powerful application of cohort analysis marketing because it directly predicts long-term revenue. Acquisition metrics tell you how many customers you gained; retention metrics tell you how many you kept. Growth only happens when acquisition outpaces churn, and cohort retention analysis makes both visible.
Calculate retention rate for each period as the percentage of the original cohort still active. If a monthly cohort starts with one thousand users and five hundred are active in month two, the month-two retention rate is fifty per cent. Track this metric across all cohorts to identify your natural retention curve and spot changes over time.
Identify your critical retention periods. Most businesses experience the highest churn in the first one to two periods after acquisition. If you can improve retention during this critical window, the impact compounds over the entire customer lifetime. This insight often leads to investments in onboarding experiences, welcome sequences, and early engagement campaigns through your email marketing programme.
Benchmark your retention rates against industry standards and your own historical performance. For SaaS businesses, month-one retention of eighty per cent and month-twelve retention of sixty per cent are strong benchmarks. For e-commerce, month-one repeat purchase rates of twenty to thirty per cent indicate healthy retention. Your specific benchmarks should reflect your business model and market conditions.
Measuring Campaign Performance With Cohorts
Traditional campaign measurement evaluates performance at the point of conversion: cost per lead, cost per acquisition, and immediate revenue. Cohort analysis extends this evaluation over time, revealing the true long-term value of each campaign’s customers.
Create campaign-specific cohorts by tagging users with their acquisition source using UTM parameters. Track these cohorts over three, six, and twelve months to compare lifetime metrics. A campaign that delivers customers with twice the retention rate of another campaign may be worth significantly more, even if its initial cost per acquisition is higher.
This long-term view often changes resource allocation decisions. A Google Ads campaign might deliver cheaper initial acquisitions, while an content marketing campaign delivers customers who retain longer and spend more. Without cohort analysis, the Google Ads campaign appears more efficient. With cohort analysis, the content marketing campaign might deliver superior lifetime value.
Use cohort analysis to evaluate the impact of marketing changes. When you launch a new onboarding email sequence, compare retention rates for cohorts acquired before and after the change. This before-and-after cohort comparison isolates the impact of your change from other variables, providing clearer evidence of effectiveness than aggregate metrics alone.
Advanced Cohort Applications
Revenue cohort analysis tracks not just whether users return but how much they spend over time. This reveals whether your customer base is expanding (spending more over time) or contracting (spending less). For subscription businesses, revenue cohorts expose the impact of upsells, downgrades, and price changes on customer value.
Predictive cohort modelling uses historical cohort patterns to forecast future behaviour. If your retention curve consistently stabilises at month six, you can predict the lifetime value of a new cohort based on its early retention performance. This predictive capability informs budget setting, campaign evaluation, and growth forecasting.
Segmented cohort analysis combines cohort tracking with demographic or behavioural segments. Compare retention between enterprise and SME customers, between customers in different industries, or between customers who use different features. These segmented views reveal which customer types are most valuable and which segments need different engagement strategies.
Integrate cohort insights into your customer lifetime value calculations. Cohort data provides the empirical foundation for lifetime value models by revealing actual retention rates, spending patterns, and churn timelines. This grounding in real data makes lifetime value calculations actionable rather than theoretical.
Frequently Asked Questions
What is the simplest way to start with cohort analysis?
Use GA4’s built-in cohort exploration. Set up monthly acquisition cohorts and track user retention over twelve weeks. This basic analysis requires no additional tools or data and reveals whether your retention is improving, declining, or stable over time.
How much data do I need for meaningful cohort analysis?
Each cohort should contain at least one hundred users for the analysis to be reliable. For segmented cohort analysis, you need one hundred users per segment per cohort. Businesses with lower traffic volumes should use monthly rather than weekly cohorts to accumulate sufficient data per group.
What is a good retention rate?
Retention benchmarks vary significantly by business model. SaaS businesses typically target eighty per cent month-one retention and fifty to sixty per cent at month twelve. E-commerce businesses aim for twenty to thirty per cent month-one repeat purchase rates. Compare against your own historical performance rather than generic benchmarks.
How is cohort analysis different from segmentation?
Segmentation divides your current audience into groups based on characteristics. Cohort analysis tracks specific groups over time. Segmentation is a snapshot; cohort analysis is a time-series. You can combine both by creating segmented cohorts that track specific audience segments over time.
Can I do cohort analysis in Google Sheets?
Yes. Export your data with user acquisition date and return events, create a pivot table grouping users by acquisition period, and calculate return rates for each subsequent period. Spreadsheets work well for small to medium datasets but become unwieldy for large-scale analysis.
How often should I review cohort data?
Review monthly for strategic insights and trend identification. Weekly reviews are useful during campaign launches or after significant product changes. Quarterly deep-dive analyses should inform budget allocation and strategic planning discussions.
What causes retention to drop suddenly in a cohort?
Common causes include website or product changes that introduce friction, price increases, competitor launches, seasonal patterns, and changes to email or engagement campaigns. Cross-reference the timing of the drop with business events and external factors to identify the cause.
How do I improve retention for a specific cohort?
Identify where in the retention curve the cohort is losing users, then address that specific point. Early churn often responds to improved onboarding. Mid-term churn may need better engagement content or feature education. Late-term churn might require loyalty programmes or product improvements.
Can cohort analysis predict customer lifetime value?
Yes. By observing how cohorts behave over time, you can project the retention curve and spending pattern forward. This projection estimates the total value a cohort will generate over its lifetime. The more historical cohort data you have, the more accurate these predictions become.
What is the relationship between cohort analysis and churn analysis?
Churn analysis measures the rate at which customers stop using your product or service. Cohort analysis provides the framework for measuring churn by tracking when specific groups of customers leave. Cohort-based churn analysis is more informative than overall churn rates because it reveals whether churn is improving or worsening over time.