Website Analytics Metrics Every Singapore Business Should Track in 2026
Your website is the digital shopfront of your business in Singapore. Yet far too many companies invest heavily in professional web design only to neglect the data their site generates every single day. Understanding website analytics metrics is the foundation upon which every successful digital strategy is built — without them, you are essentially flying blind.
In 2026, the analytics landscape has matured considerably. Google Analytics 4 is now the standard, privacy regulations across ASEAN are tightening, and Singapore businesses face a more competitive online marketplace than ever before. Whether you run an e-commerce store, a B2B consultancy, or a local services firm, knowing which metrics to monitor — and how to interpret them — can mean the difference between growth and stagnation.
This guide breaks down the ten most important website analytics metrics for Singapore businesses. We will define each metric, explain the formula behind it, provide regional benchmarks where available, and show you how to turn raw data into actionable insights that drive real results.
Sessions and Users: Understanding Your Traffic Volume
Sessions and users are the two foundational volume metrics in any analytics platform. A session is a group of interactions a single user takes within a given time frame on your website. By default, a session expires after 30 minutes of inactivity. A user represents a unique visitor identified by a cookie or device identifier.
It is important to distinguish between the two. One user can generate multiple sessions — for example, someone who visits your site on Monday morning and again on Wednesday afternoon counts as one user but two sessions. In GA4, the metric active users has replaced the older total users, focusing on users who had an engaged session.
For Singapore businesses, tracking both metrics over time reveals the overall health of your digital presence. A steady increase in users suggests your SEO efforts and marketing campaigns are reaching new audiences. A high sessions-to-users ratio indicates strong return visit behaviour, which is typically a positive sign for content-heavy or e-commerce sites.
Formula: Sessions per User = Total Sessions ÷ Total Users. A healthy benchmark for most Singapore SME websites is between 1.4 and 2.0 sessions per user.
Page Views and Pages Per Session
A page view is recorded each time a page on your website is loaded or reloaded in a browser. It is the simplest content consumption metric available. Pages per session measures the average number of pages a user views during a single session.
Formula: Pages per Session = Total Page Views ÷ Total Sessions.
This metric is particularly useful when paired with your site structure. If you have designed clear navigation paths — say, from a blog article to a service page to a contact form — a higher pages-per-session figure suggests users are following that journey. For most Singapore business websites, a benchmark of 2.0 to 3.5 pages per session is reasonable.
However, context matters enormously. A single-page application or a landing page designed for Google Ads campaigns might intentionally have a low pages-per-session count because all the information — and the conversion action — sits on one page. Always interpret this metric in light of your site architecture and campaign objectives.
Bounce Rate: What It Really Tells You
Bounce rate has long been one of the most misunderstood website analytics metrics. In Universal Analytics, a bounce was a session with only one page view. In GA4, the concept has been replaced by its inverse: engagement rate. An engaged session is one that lasts longer than ten seconds, has a conversion event, or includes two or more page views.
Formula (GA4): Bounce Rate = 100% − Engagement Rate. Or equivalently, Bounce Rate = Non-Engaged Sessions ÷ Total Sessions × 100.
A high bounce rate is not always bad. Blog articles that fully answer a user’s question in one visit can have high bounce rates while still serving their purpose brilliantly. Conversely, a high bounce rate on a product page or pricing page is a red flag that the content or user experience needs attention.
For Singapore websites, average bounce rates typically range from 40% to 65%, depending on the industry. Service-based businesses tend to see lower bounce rates because visitors navigate to multiple pages to evaluate offerings. If your bounce rate exceeds 70%, it is worth auditing your content strategy and page load experience.
Average Session Duration and Engagement Time
Average session duration measures how long, on average, users spend on your website during a single session. In GA4, the preferred metric is average engagement time per session, which only counts time when your site is in the foreground of the user’s browser — a far more accurate measure.
Formula: Average Engagement Time per Session = Total User Engagement Time ÷ Total Sessions.
For content-rich websites such as blogs, news sites, or educational platforms, a longer engagement time generally correlates with higher content quality and relevance. For Singapore B2B companies, average engagement times of 1.5 to 3 minutes are common for service pages, while blog content might see 2 to 5 minutes if the articles are thorough.
Low engagement times paired with high traffic volumes may indicate a mismatch between user expectations and page content. This often occurs when meta descriptions or ad copy promise something the landing page does not deliver — a common pitfall in digital marketing campaigns.
Traffic Sources and Channel Groupings
Understanding where your visitors come from is just as important as knowing how many you have. GA4 groups traffic into default channel groupings: Organic Search, Paid Search, Direct, Referral, Organic Social, Paid Social, Email, and several others.
For most Singapore businesses, the primary traffic sources break down as follows:
- Organic Search: Visitors who find you through Google, Bing, or other search engines. This channel reflects the strength of your SEO.
- Paid Search: Traffic from pay-per-click campaigns, primarily Google Ads.
- Direct: Users who type your URL directly or access your site via bookmarks. High direct traffic often indicates strong brand recognition.
- Referral: Visitors arriving from links on other websites.
- Organic Social: Traffic from unpaid social media posts on platforms like Facebook, Instagram, LinkedIn, or TikTok.
- Email: Users clicking through from email marketing campaigns.
Tracking channel performance over time helps you allocate your marketing budget wisely. If organic search delivers the highest conversion rate, doubling down on SEO content makes sense. If paid social drives volume but few conversions, it may be time to revisit your targeting or creative.
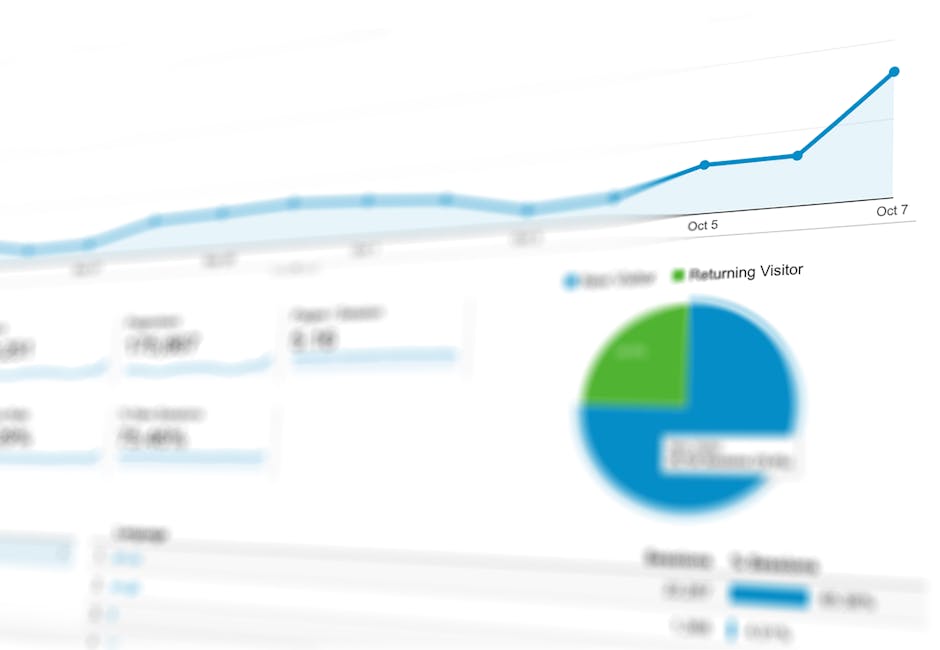
New vs Returning Visitors
The balance between new and returning visitors reveals the health of both your acquisition and retention efforts. New users are visiting your site for the first time within the reporting period. Returning users have visited at least once before.
Formula: New User Percentage = New Users ÷ Total Users × 100.
A healthy Singapore business website typically sees 60% to 75% new visitors. If the ratio skews too heavily towards new visitors (above 85%), you may have a retention problem — people arrive but never come back. If it skews too heavily towards returning visitors (below 50%), your acquisition channels may be underperforming.
Returning visitors are especially valuable because they tend to convert at higher rates. They are already familiar with your brand and offerings. Segmenting your analytics by visitor type can reveal whether your social media campaigns are better at attracting new audiences while your email efforts excel at bringing people back.
Exit Pages and Drop-Off Analysis
An exit page is the last page a user views before leaving your website. The exit rate for a given page is the percentage of sessions that ended on that page out of all sessions that included that page.
Formula: Exit Rate = Exits from Page ÷ Total Views of Page × 100.
Not all exits are bad. Your thank-you page after a form submission should have a high exit rate — the user has completed the desired action. Similarly, a blog article that fully satisfies a query will naturally have a higher exit rate. The pages to worry about are those in the middle of a conversion funnel — product pages, pricing pages, or checkout steps — where a high exit rate signals friction or confusion.
For Singapore e-commerce sites, monitoring exit rates at each stage of the checkout process is critical. If your shipping information page has a 60% exit rate, it may be because international shipping costs surprised the buyer, or because the page loads too slowly on mobile devices.
Site Speed Metrics and Core Web Vitals
Site speed directly impacts both user experience and search engine rankings. Google’s Core Web Vitals remain a ranking factor in 2026, and Singapore users — accustomed to some of the fastest internet speeds in the world — have exceptionally low tolerance for slow-loading pages.
The three Core Web Vitals to monitor are:
- Largest Contentful Paint (LCP): Measures loading performance. Aim for LCP to occur within 2.5 seconds of when the page first starts loading.
- Interaction to Next Paint (INP): Measures interactivity. Aim for an INP of 200 milliseconds or less.
- Cumulative Layout Shift (CLS): Measures visual stability. Aim for a CLS score of 0.1 or less.
You can monitor these metrics through Google Search Console, PageSpeed Insights, and the Web Vitals report in GA4. For Singapore businesses targeting local audiences, test your site speed from Singapore-based servers. A site hosted on a server in the United States might perform well in American speed tests but lag noticeably for visitors in Southeast Asia.
Improving site speed often requires collaboration between your marketing team and your web design partner. Common fixes include image compression, lazy loading, minimising render-blocking JavaScript, and upgrading to a faster hosting provider with Singapore or regional data centres.
Frequently Asked Questions
What is the most important website analytics metric for Singapore SMEs?
There is no single most important metric — it depends on your goals. However, for most Singapore SMEs, conversion rate by traffic source is arguably the most actionable metric because it tells you which channels are delivering visitors who actually take the desired action, whether that is filling in a contact form, making a purchase, or calling your office.
How often should I check my website analytics?
For most businesses, a weekly review of key metrics is sufficient, with a more thorough monthly analysis. Avoid checking daily unless you are running time-sensitive campaigns, as daily fluctuations can lead to reactive decision-making based on statistical noise rather than genuine trends.
Why does GA4 show different numbers from Universal Analytics?
GA4 uses an entirely different data model based on events rather than sessions. It also defines metrics differently — for example, bounce rate in GA4 is the inverse of engagement rate, whereas in Universal Analytics it was based purely on single-page sessions. The two platforms are not directly comparable, so establish new baselines in GA4 rather than trying to match old UA figures.
What is a good bounce rate for a Singapore business website?
A bounce rate between 40% and 60% is generally considered healthy for Singapore business websites. Landing pages and blog content may see rates up to 70% without cause for concern, while product pages and service pages should ideally stay below 50%. Always compare against your own historical data rather than relying solely on industry benchmarks.
How does site speed affect my search rankings in Singapore?
Google uses Core Web Vitals as a ranking signal globally, including for searches conducted in Singapore. A slow site may be penalised in organic search rankings relative to faster competitors. Given that Singapore has one of the highest mobile internet penetration rates in the world, mobile site speed is especially important for local SEO performance.
Should I track website analytics metrics separately for mobile and desktop?
Yes. In Singapore, mobile traffic often accounts for 65% to 75% of total website visits. Mobile and desktop users behave differently — mobile sessions tend to be shorter with fewer pages per session. Segmenting your analytics by device type helps you identify UX issues specific to each platform and prioritise improvements accordingly.